Identifying indigenous groups in surveys and censuses is a challenge in Latin America
Latin America is characterized by wide and persistent disparity among ethnic groups (Bustillo et al., 2018; ECLAC, 2016; Telles, 2007). By most measures of well-being, including education, ethnic minorities are among those most adversely affected by the region’s development challenges (Hall and Patrinos, 2012; Telles et al., 2015). Yet, despite recent progress in collecting information on ethnicity, Latin America faces significant challenges in effectively targeting policies to indigenous peoples, as countries lack comparable data of sufficient quality on exact numbers and distribution. Capturing indigenous identity in surveys is hampered by its many dimensions and further complicated by historical nation-building processes that embraced mestizaje, or mixing of ethnic and cultural groups, which made indigenous peoples invisible (Telles et al., 2015).1
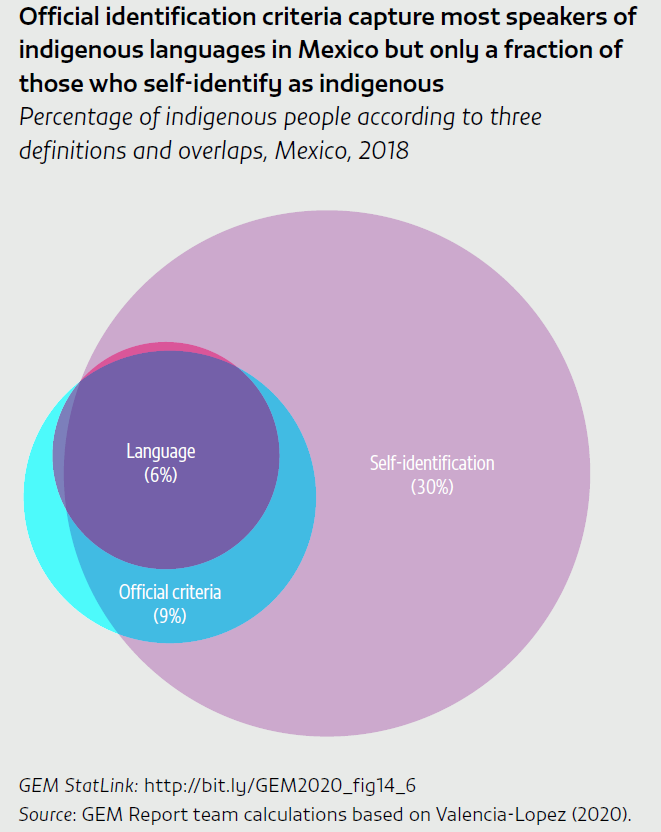
There is lack of consensus in the region on how to measure ethnicity. Self-identification is the prevalent approach, but countries have also used other criteria, such as common origin, territoriality and cultural-linguistic factors (Del Popolo, 2008). Countries apply these criteria in various ways in data collection instruments. For instance, in addition to self-identification, Mexico applies an official household-level criterion defined by the National Commission on Indigenous Peoples: Indigenous people are those living in households whose heads (or spouses) or their parents speak an indigenous language (CDI, 2017).
Demographic shifts have blurred ethnic boundaries and given rise to fluid indigenous identities and imperfect congruence between criteria. Indigenous population estimates vary considerably, depending on the criterion used (INEE, 2017; Telles and Torche, 2019). Six countries in the region have data on both self-identification and linguistic criteria: the Plurinational State of Bolivia, Ecuador, Guatemala, Mexico, Paraguay and Peru. Peru has the highest proportion of self-identified indigenous people (almost two in three). In Paraguay, 1.7% self-identify as indigenous, while about three in four speak an indigenous language – the highest proportion in the region. Ecuador has the lowest proportion of indigenous speakers among the six countries (4.8%).
Self-identification is the increasingly dominant criterion, consistent with the International Labour Organization’s Indigenous and Tribal Peoples Convention. However, used alone, it can provide inconsistent estimates of education inequality. Education outcomes of speakers of indigenous languages are often worse than those of self-identified indigenous people who speak only Spanish (INEE, 2017; Planas et al., 2016). Across four national household surveys in 2018, school attendance among 15- to 17-year-olds in the Plurinational State of Bolivia, Guatemala, Mexico and Peru was 3 to 20 percentage points lower among speakers of an indigenous language than among all those identifying as indigenous (Valencia Lopez, 2020). Skin colour tends to be a better predictor of years of schooling than the census criterion, especially after controlling for social class (Flores and Telles, 2012). Recent research in Brazil, Mexico and Peru showed persistent inequality by skin colour, language and, in some countries, self-identification, after controlling for social class (Telles et al., 2015; Villarreal, 2014).
Indigenous groups defined by different criteria may have distinct education needs. Education policy responses in countries with low concordance of self-identification and indigenous language vary. Mexico enforces intercultural indigenous curricula in schools with high levels of self-identified indigenous groups, but whether these are administered in an indigenous language should depend on whether students speak it, not on whether they self-identify as indigenous (Valencia Lopez, 2020).
One reason for the discrepancy in education outcomes between indigenous groups identified according to identity or language may be insufficient household- or school-level language transmission and a resulting shift in identity. There is evidence that indigenous individuals do not identify their children as having their ethnicity, reflecting cross-generation fluidity (Villarreal, 2014). Individuals may also change how they perceive their ethnic identity.
Longitudinal data from Mexico’s national household living conditions survey offer insights into the fluidity of ethnic identity. The ethnicity question is comparable over time, and responses are individual rather than by household head as proxy. Individuals who identified as indigenous in the first wave in 2002 exhibited high levels of fluidity: Half had changed ethnic identity at least once by 2009. Education level is associated with more constant self-declaration of ethnicity, consistent with the ethnic pride hypothesis. Speaking an indigenous language is also associated with a lower likelihood of individuals later declaring themselves non-indigenous. Living in a city reduces the likelihood of consistent indigenous identity.
Urban migration and loss of indigenous language proficiency over generations result in complex processes of negotiating identity. Anthropological research has documented how the presence of indigenous peoples in urban areas led to new forms of indigenous identity expression (Gomez Murillo, 2008). In Guatemala and Mexico, urban migration resulted in loss of indigenous languages, once the main marker of indigenous identity, as indigenous peoples gained access to local, predominantly Spanish-speaking labour markets (Telles and Torche, 2019; Yoshioka, 2010).
Focuses published in Equity
How many children attend single-sex schools?
Identifying indigenous groups in surveys and censuses is a challenge in Latin America
Education spending should focus on equity
Household wealth does not capture all dimensions of poverty
First-generation students have it hard everywhere
Peers affect individual education outcomes
References
This Focus is based on Valencia Lopez (2020). The full list of references can be found at this link.
